Annual Report
Your annual report is a chance to highlight your impact, celebrate successes, and let your audience know what’s coming next. With the right storytelling and design, your report becomes a powerful tool to build trust, strengthen relationships, and showcase your mission in action.
Even better, the stories, visuals, and data you create for your annual report can be repurposed into videos, social posts, and graphics that keep your message alive all year long.
Highlight your milestones and impact in a way that resonates with stakeholders
Share compelling stories that put people and progress at the center
Create a polished, professional piece that reflects your brand
Engage diverse audiences by offering your annual report in multiple formats for maximum reach
Inspire ongoing support and engagement with clear, forward-looking messaging


Powering Your Annual Report with the Best Tools
Our Trusted Network
Looking for something else? We’ll connect you with trusted partners in our network to make sure you have everything you need.
Let’s Work Together
Let’s connect and kickstart our journey. Together we can exchange ideas, explore synergies, and create something amazing!
Schedule Introduction
Frequently Asked Questions About Annual Reports
Why is an annual report important for my organization?
An annual report helps your organization communicate its mission, showcase accomplishments, and build trust with stakeholders. More than a summary of numbers, it’s a storytelling tool that highlights impact, celebrates milestones, and keeps supporters, donors, or investors informed and engaged. A well-crafted report can strengthen relationships and inspire ongoing support.
How do I make my annual report engaging for stakeholders?
To capture attention, combine storytelling with strong visuals. Include personal stories, testimonials, photos, videos, and data presented in an easy-to-digest format. Using animation or infographics can help make complex information clear and memorable. By focusing on both impact and narrative, your report becomes something stakeholders want to read and share.
What should be included in an annual report?
A strong annual report typically includes an overview of your mission, key accomplishments, financial highlights, impact stories, and forward-looking goals. Supporting visuals—like photos, charts, and infographics—help make data and outcomes easy to understand. You can also include video clips or audio summaries to engage different audiences.
When should organizations publish an annual report?
Most organizations publish annual reports once a year, often after the fiscal year ends. However, the timing should allow for accurate data collection, content creation, and review. Some organizations also share mid-year updates or mini-reports to maintain engagement with stakeholders and keep their mission top-of-mind.
What is the ideal length for an annual report?
The ideal length balances detail with readability. Most annual reports range from 20–60 pages, but shorter reports can work if they focus on key achievements and impact. Including clear headings, visuals, and concise storytelling ensures your audience can quickly understand your organization’s accomplishments without feeling overwhelmed.
Do organizations need to publish an annual report?
While not always legally required, annual reports are a best practice for transparency, trust-building, and stakeholder engagement. They give supporters, donors, and investors a clear picture of your mission, progress, and plans for the future. Organizations that publish annual reports often see stronger relationships and increased confidence from their audience. Even as a small business, an annual report can be a powerful way to tell your story and showcase your progress.
How can storytelling improve my annual report?
Storytelling turns facts and figures into compelling narratives that stakeholders can connect with emotionally. Sharing personal stories, community impact, or behind-the-scenes moments makes your report memorable, builds trust, and helps readers understand why your organization’s work matters. Combined with visuals and data, storytelling can transform your annual report into a tool for engagement and inspiration.
How do I make complex data easy to understand in an annual report?
Use visual tools like charts, infographics, and animated graphics to simplify numbers and trends. Break data into clear sections with descriptive headings, and pair it with short explanations or stories that put it in context. Presenting information visually and narratively makes your report accessible to a wider audience, including donors, partners, and board members.
Join our Community of Happy Clients

“From day one, they took the time to truly understand ICIC’s mission and the communities we serve. They don’t just produce videos — they align with our values and help us tell stories that matter. Their team brings both creativity and strategic insight to every project. They guide us thoughtfully through the process, ensuring that the final product is not only visually compelling but also meaningful and impactful. They understand how to translate complex ideas and mission-driven work into authentic, engaging content. Beyond their talent, they are collaborative, responsive, and simply wonderful to work with.”
Sarah Ginand
ICIC

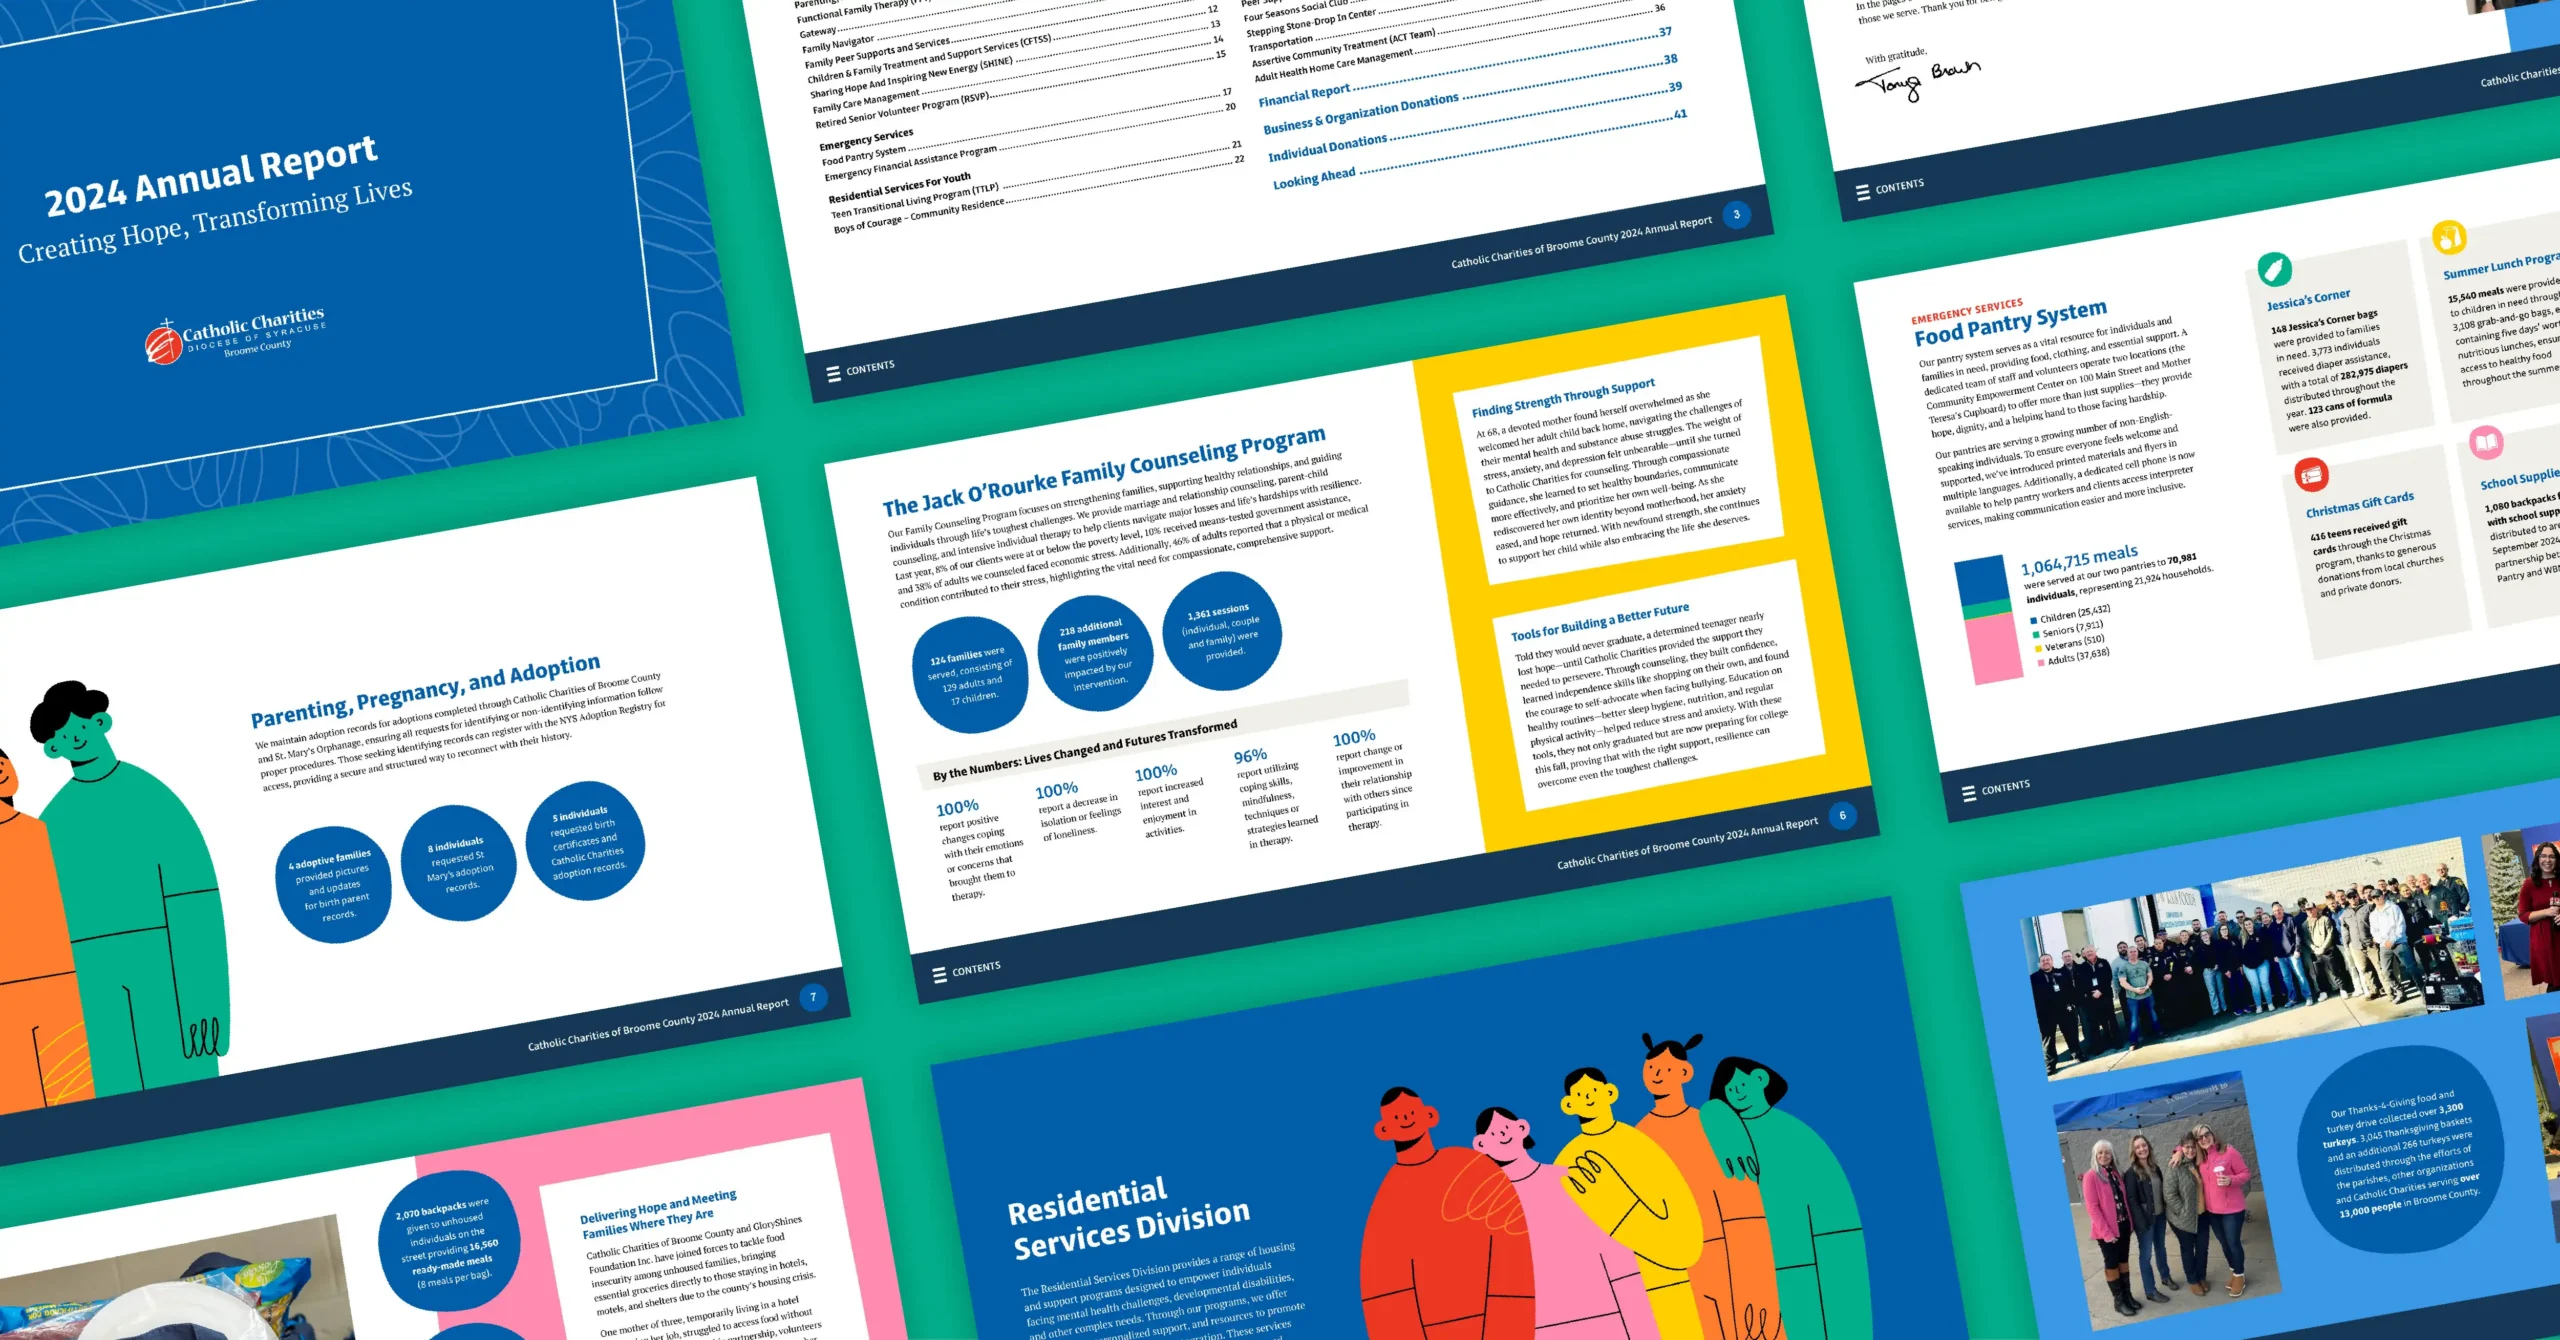
“We’d been doing just a print version for many years, but we expanded it to doing a print and electronic version, using some videos to tell our story. I think they’ve captured a lot of the heart of what goes on in our programs. There’s nothing like really seeing it and hearing it from clients whose lives have been impacted very significantly, and from the staff who get a lot of satisfaction from doing this work.”
Lori Accardi
Catholic Charities of Broome County


